SPC Software
Trusted SPC Software since 1982.

We developed the first SPC software for MS-DOS (1983) and MS Windows (1991). Our longevity in developing innovative SPC software is a testament to our dedication to working with our customers to improve their operational efficiency.
- Thousands of SPC software licenses worldwide
- Trusted SPC calculations with advanced features
- Customer-focused development
- Application expertise offered by best-selling author
- Timely, dependable technical support
Download a FREE TRIAL to see why thousands of clients worldwide have improved their processes with our SPC software products.
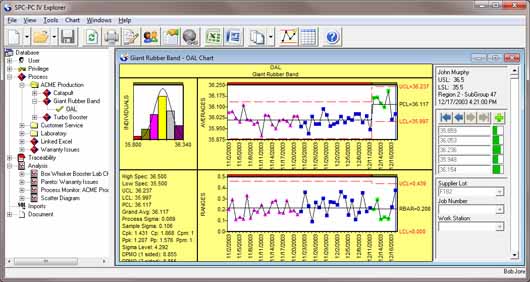
SPC-PC IV Explorer
Our highly-acclaimed SPC-PC IV Explorer control chart software provides an ideal, cost-effective approach to create control charts and monitor processes for single user to large enterprise solutions. Recognized as a leading all-purpose SPC software package for managing your key processes, it has a tremendous wealth of standard features. If you're looking for a secure means of controlling access to your data, without the hassles of file management, this is the most cost-effective solution in the market! See details
QA-Calibrate
QA-Calibrate is an easy to use gage calibration & management software for managing and analyzing results of gage calibrations and R&R studies. Also available as an option with our popular SPC-PC IV Explorer software, so gage management is integrated with the process data it will collect. See details
SPC IV Excel
SPC IV Excel is an easy to use affordable solution for creating Statistical Process Control charts. A COM Add-in to Microsoft© Excel, it leverages the power of the world's most popular spreadsheet program with Quality America's 30 years of experience in developing control charts for SPC software. See details
Green Belt XL
Green Belt XL can be used by Six Sigma Teams to build consensus and perform rapid, easy to understand Six Sigma analysis of any process. Includes all the control chart and analysis features of our popular SPC IV Excel, with additional problem-solving and consensus-building tools. See details